← Work

Outcome

Expansion and operations managers in Italy now pick locker locations from one map, with population, coverage, and reach side by side, and hand shortlists to each other instead of re-doing the search.

2 months

from first research to launch

~20 people

in the first market, Italy

1 tool

replacing each market's own solution, with all markets moving next

Source: interviews with 5 expansion and operations managers, 3 in Italy and 2 in Germany, September 2026. It replaces a previous GLS tool, so there's no before and after comparison yet. We measured a UMUX baseline at launch and repeat it after two months of use.

Problem

GLS wants one out-of-home network across Europe, but every market chose locker locations its own way. Germany paid for an expensive third-party tool. Other markets used an in-house tool that was unreliable, slow to change, and hard to use.

Teams couldn't compare markets, and work from one person rarely reached the next. The new tool had to launch by November.

How it works

See the market

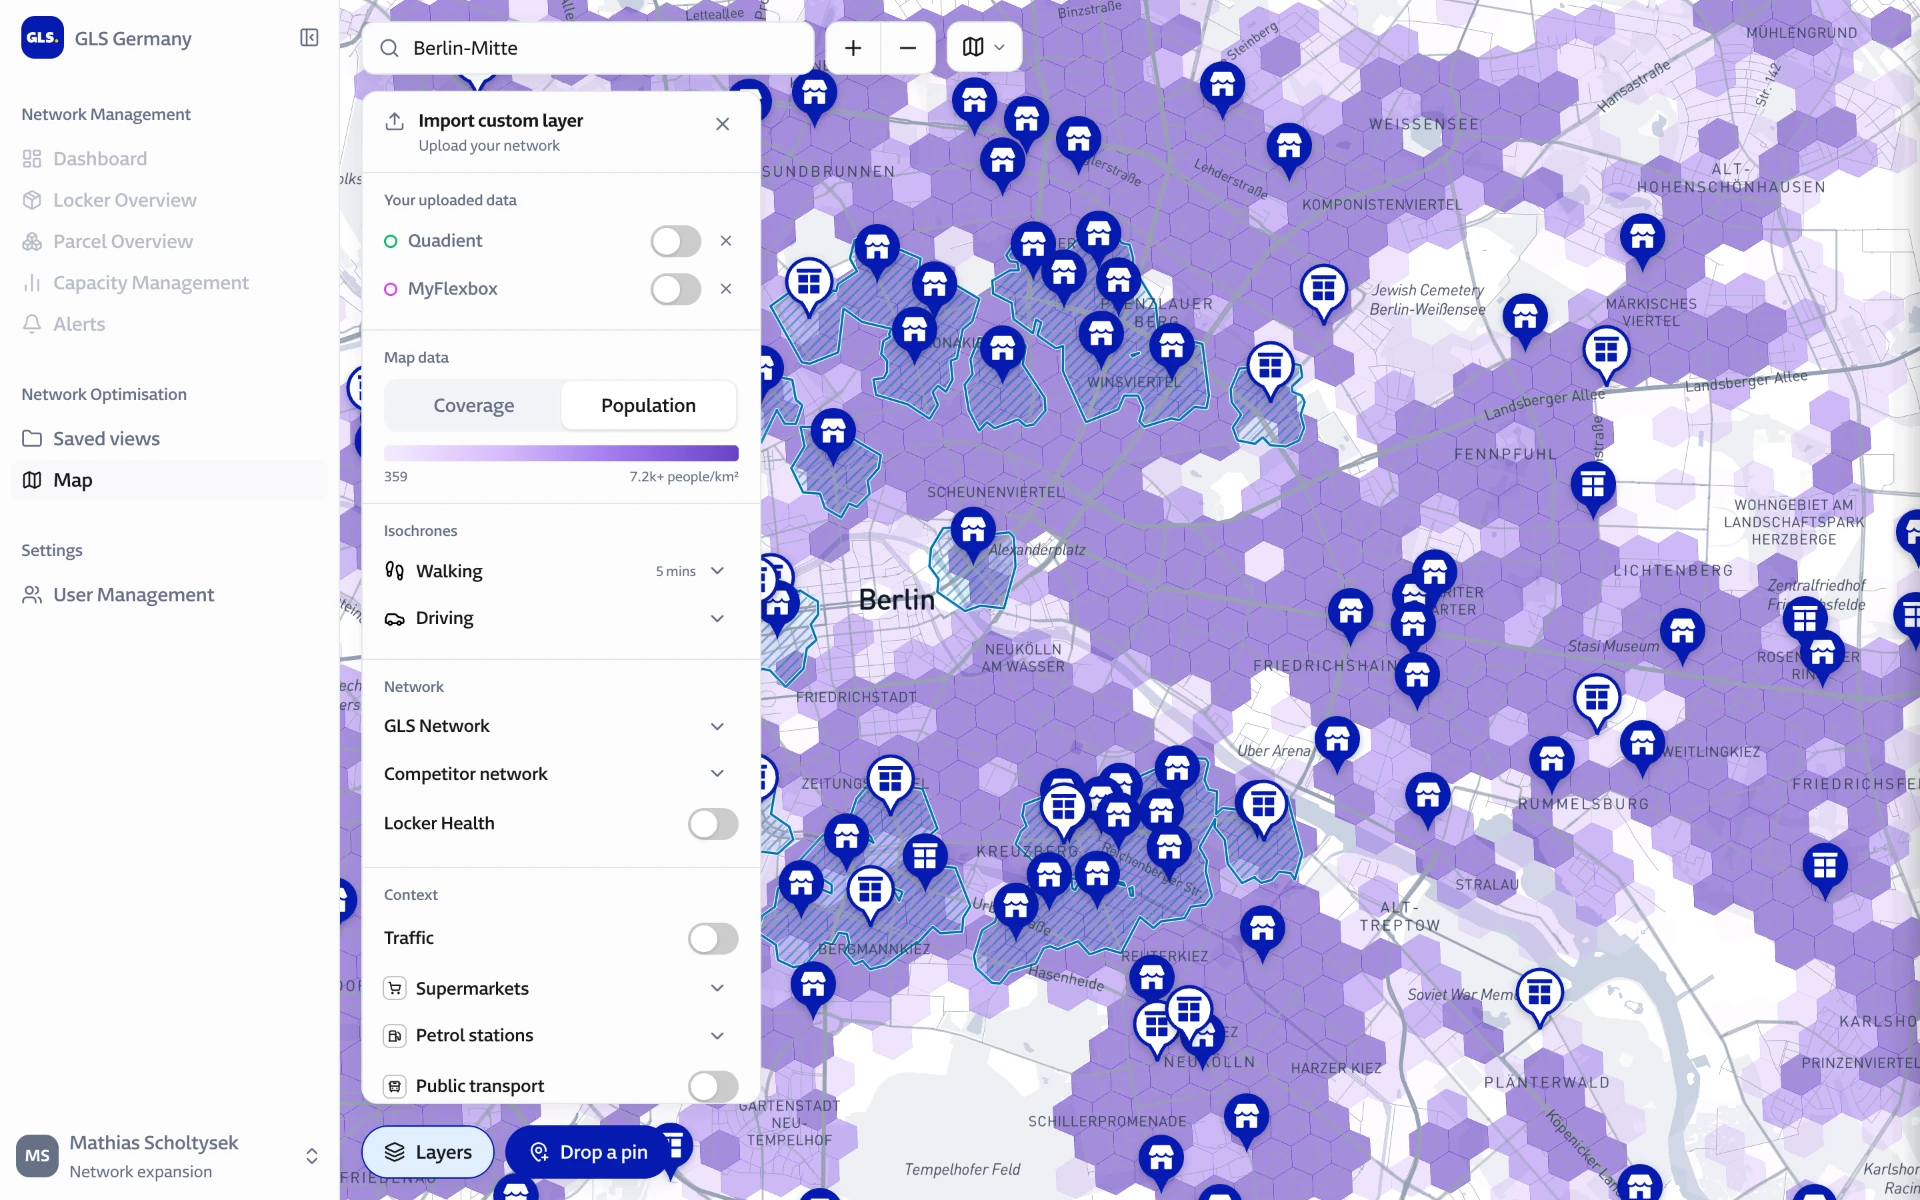
The map shows where people live, down to 100 by 100 meters, and where the network already reaches them. Gaps get darker as more people go unserved.

Population, coverage, reach, and context sit in one layers panel, so the map starts simple and gains detail only when someone asks for it.
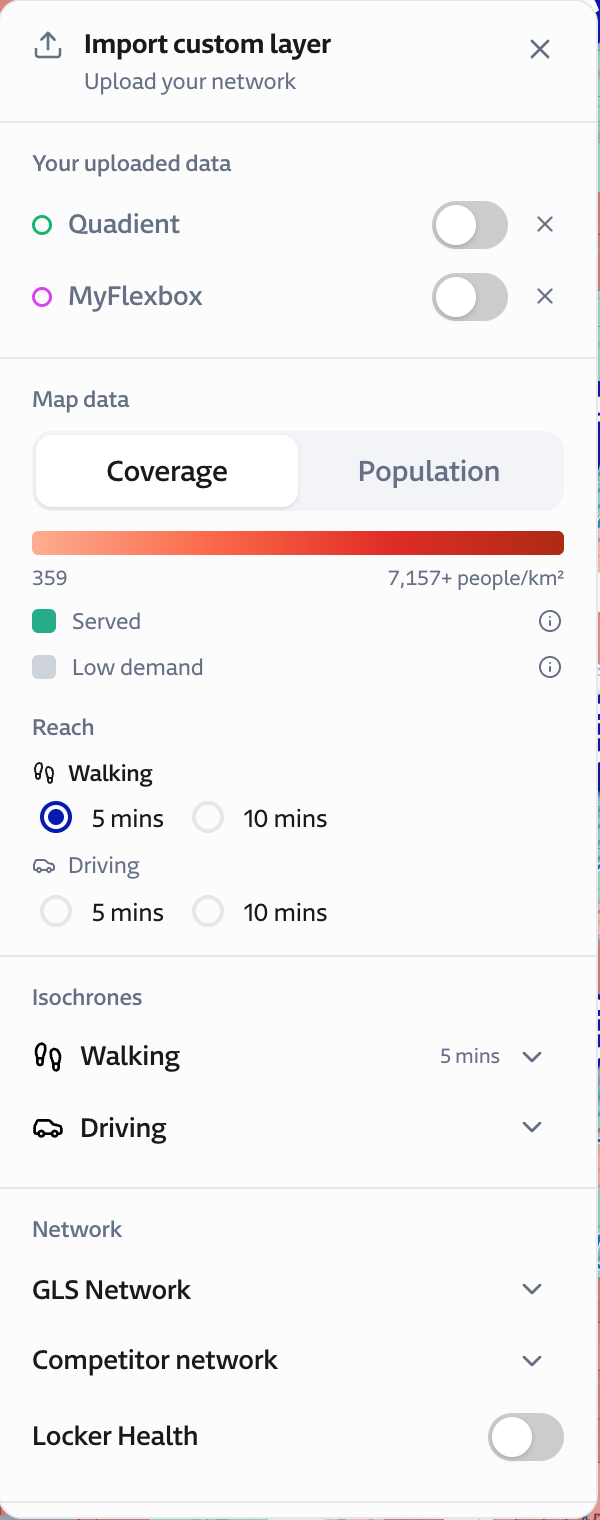
Layers panel with coverage, population, reach, isochrones, network, and context layers.
Berlin map colored by population density per hexagon, with GLS lockers on top.
The same area by population. Switching the layer keeps the network and reach in place.

Check a spot

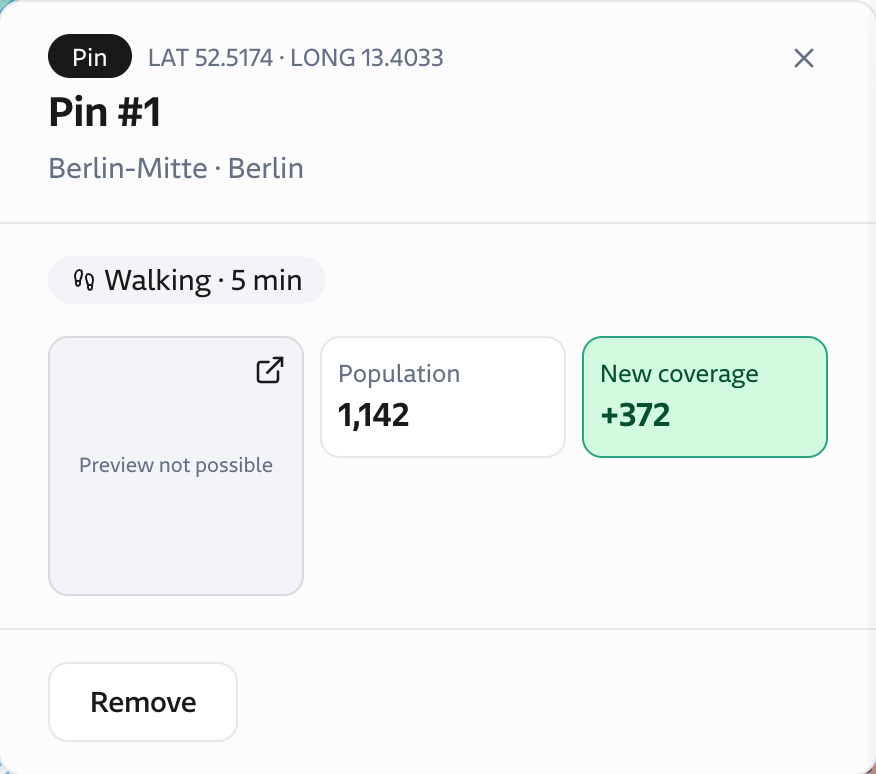
Dropping a pin shows who a locker there would reach on foot or by car, and how many of them aren't covered today.

Reach shows as isochrones, the real walking or driving area, while coverage stays in hexagons. Each answers a different question, so I kept both and let the pin bring them together.

Pin details: walking reach of 5 minutes, population 1,142, and 372 people newly covered.
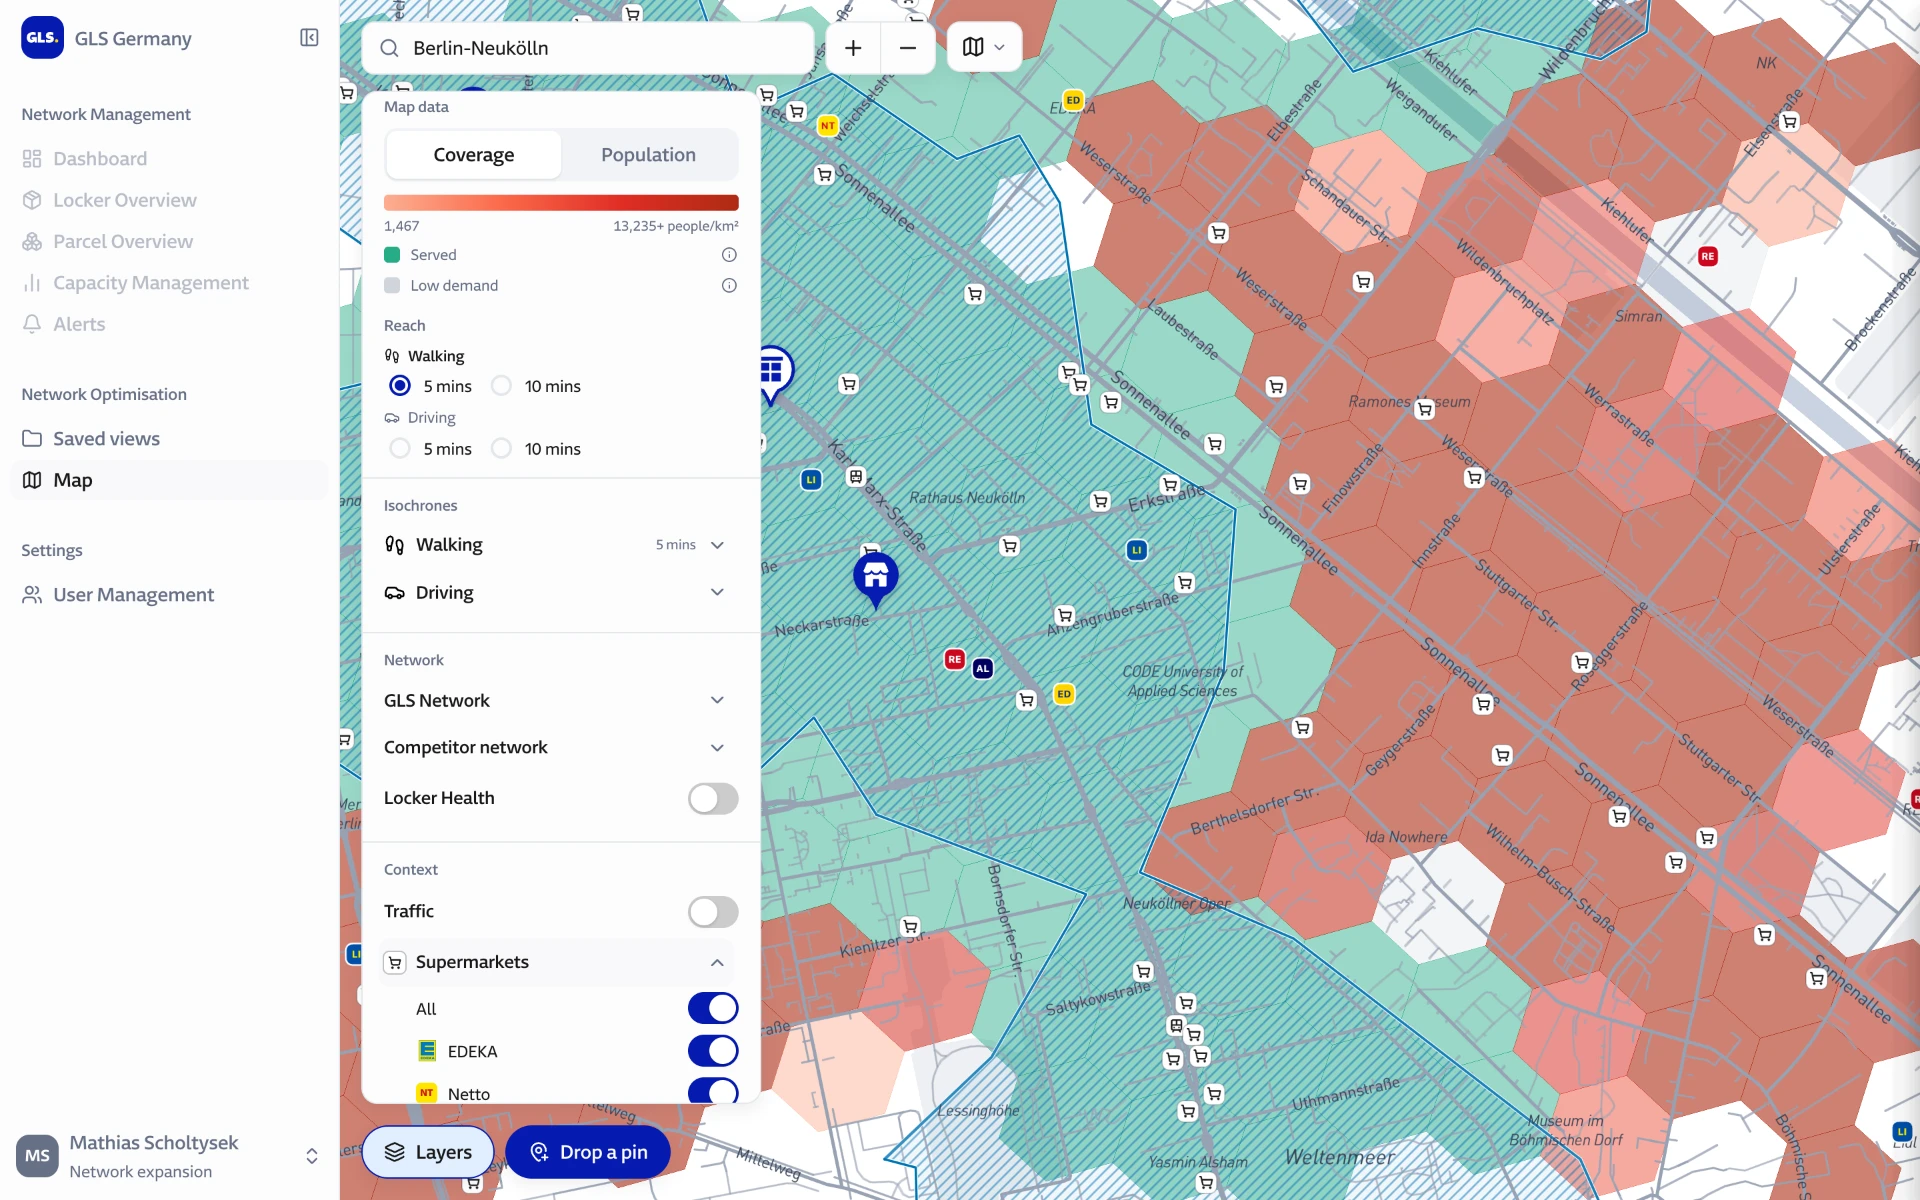
Map of Berlin-Neukölln with supermarkets and transit stops over coverage hexagons.
Supermarkets and public transport on top of coverage. The places people already go make the best hosts.

Hand it on

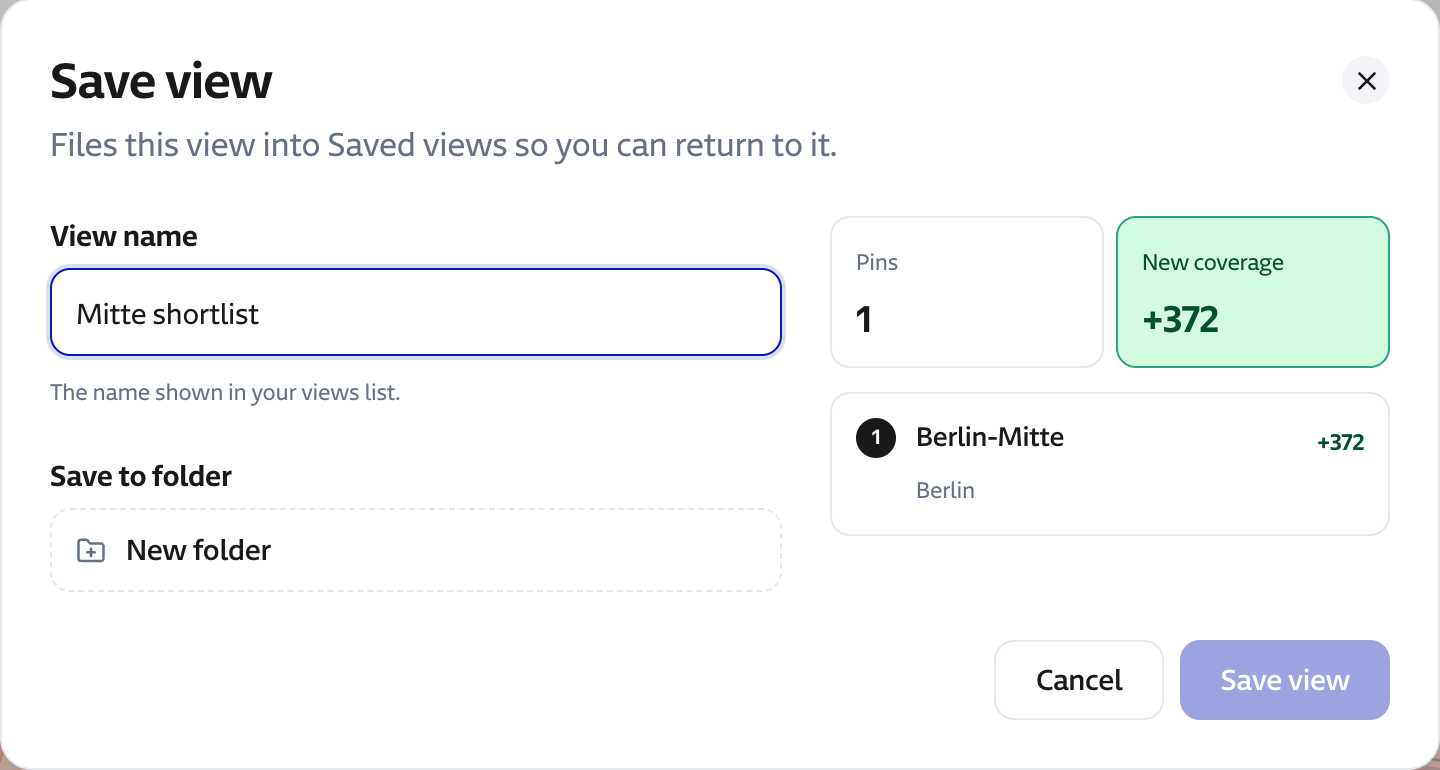
A shortlist of pins saves as a named view in a shared folder. Someone else on the team opens it and continues where the first person stopped.

Save view dialog naming a shortlist with one pin and 372 people newly covered.

Decisions

Severity in shades, not a traffic light

I dropped a traffic-light system. Gaps use one red scale that darkens as more people go unserved, and served areas are green, so severity reads from how dark a hexagon is and color-blind users can use the full map. I used AI to simulate different types of color blindness and check the map's accessibility before handover.

A feature I cut

Users asked for city totals: people served and lockers per city. It doesn't help anyone find the next location, and the November date was fixed, so I shipped without it and will check whether teams still miss it.

What's next

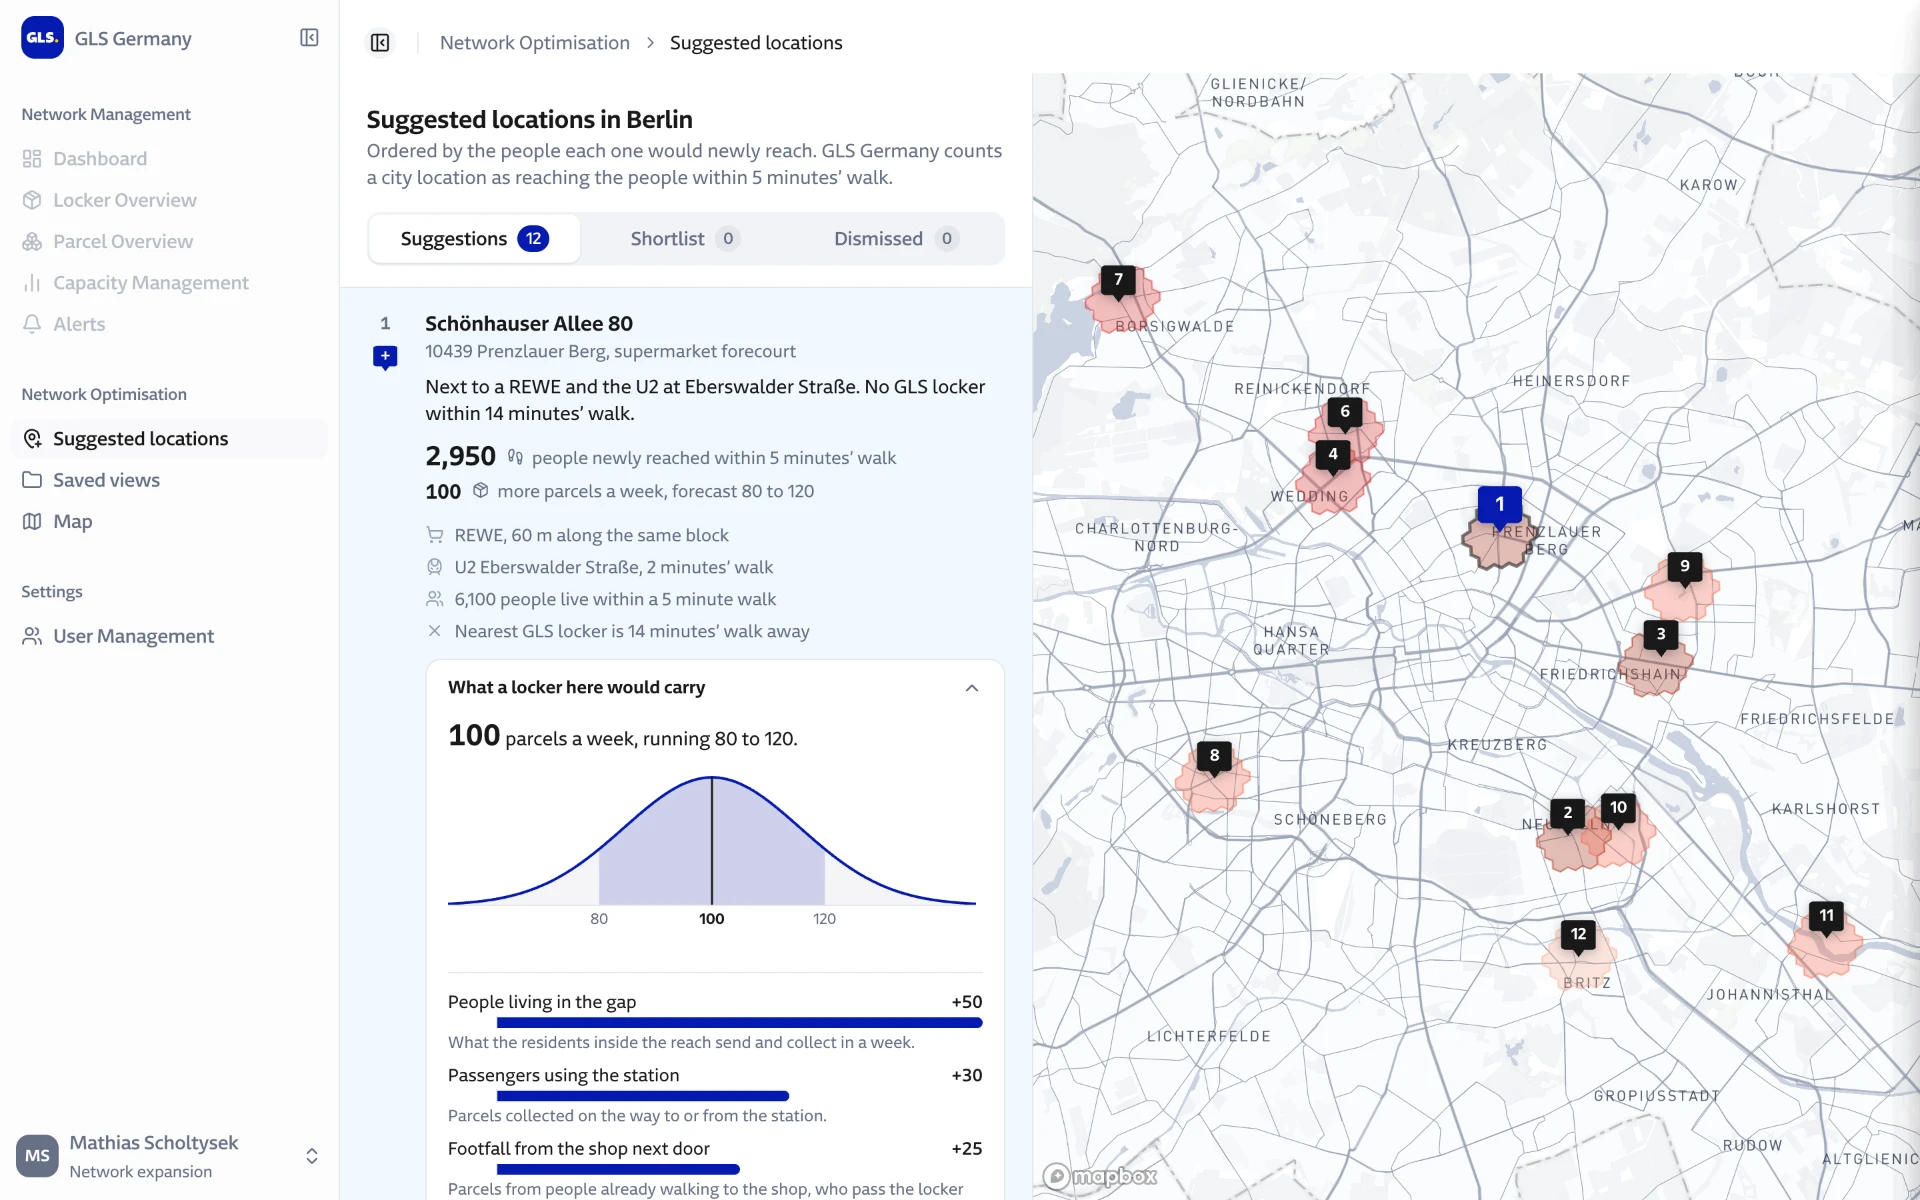
Together with the data team, I turned what markets told us about good hosts into a model. The next version opens with suggested locations instead of an empty map: each one says why it was picked, how many people it would newly reach, and how many parcels a week a locker there would carry. The map stays one click away for exploring.

Suggestions first

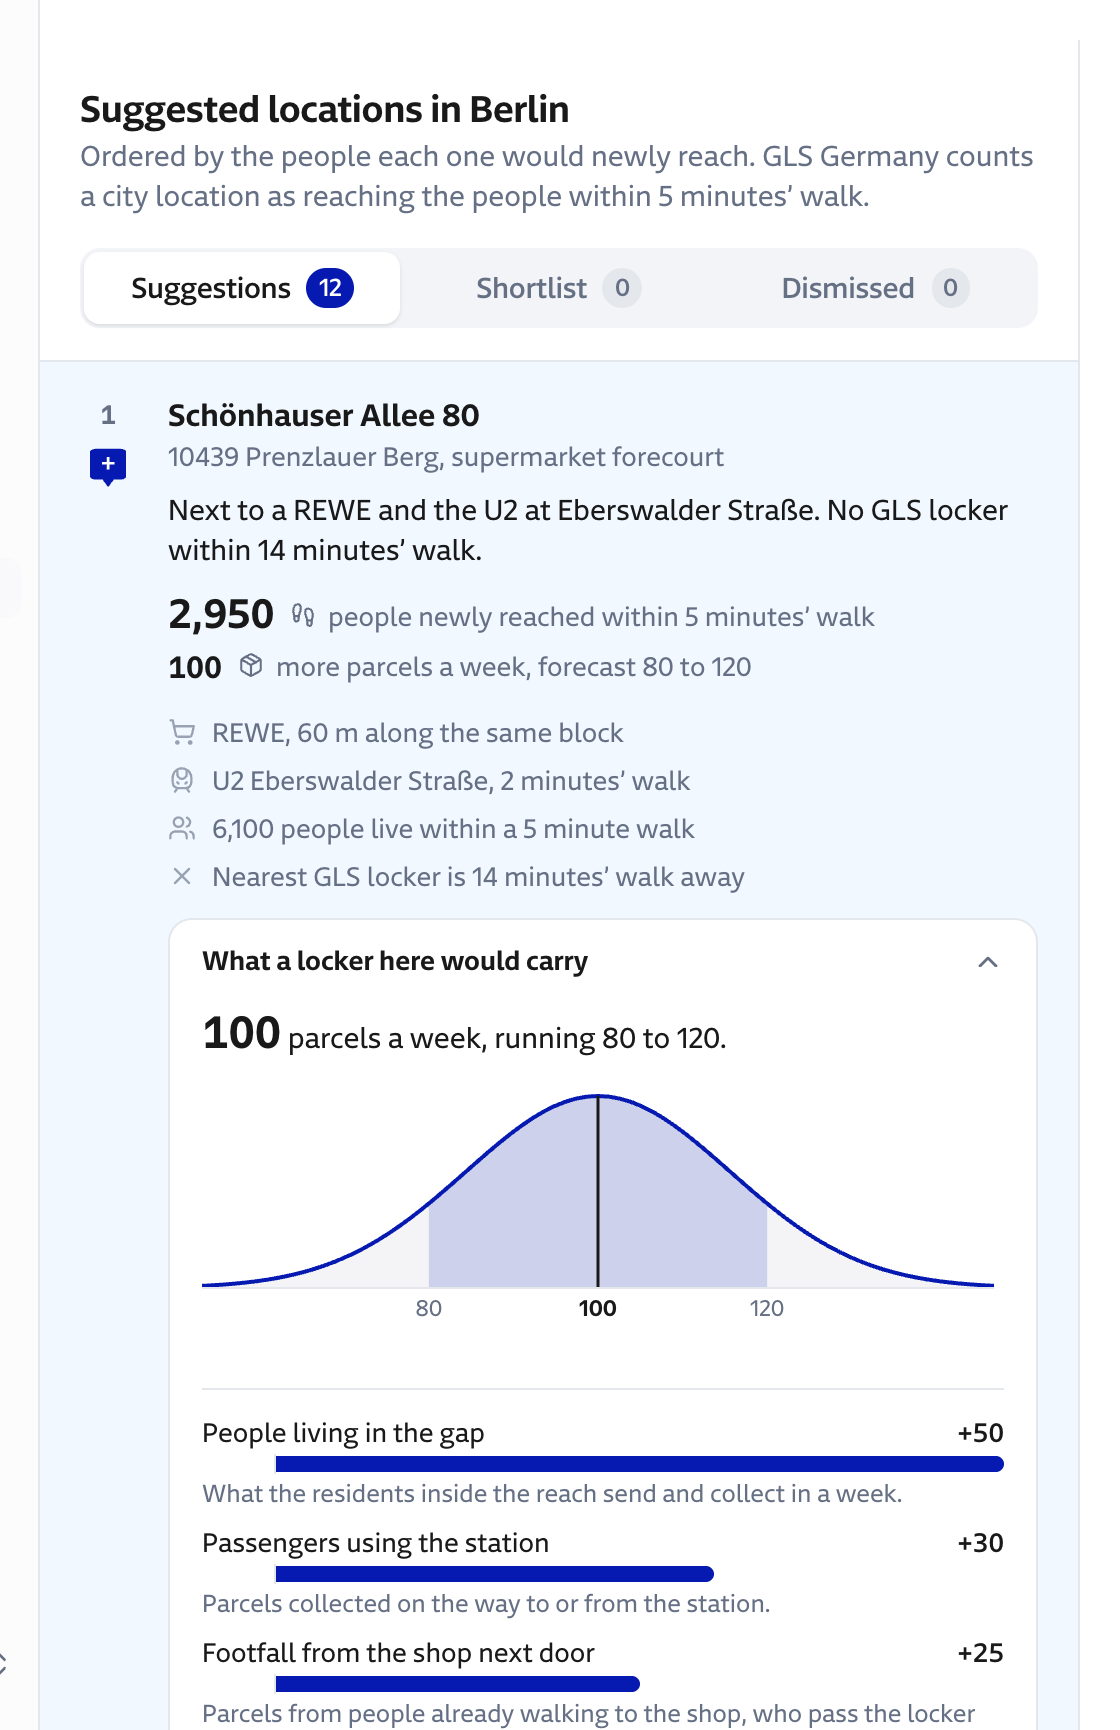
Each suggestion leads with its reason in plain words, such as 'Next to a REWE and the U2 at Eberswalder Straße. No GLS locker within 14 minutes' walk.'

The parcel forecast shows a range, 80 to 120 a week, and what adds to it: people living in the gap, passengers at the station, and footfall from the shop next door. Teams see why a spot scores well, not just that it does.

Suggestion for Schönhauser Allee 80: 2,950 people newly reached, about 100 parcels a week, and the factors behind the forecast.
Suggested locations in Berlin: a ranked list on the left and 12 numbered suggestions on the map.
Concept for the next version: 12 suggestions for Berlin, ranked by people newly reached, with shortlist and dismiss beside them.

What I learned

This project pushed me further toward design engineering. I set up a back end, connected the APIs and data, and handed engineering a working prototype instead of a spec, which sped up development.